While most of the Bay Area saw significant shifts to more uncertain and uneven markets in April, the
SF house market remained characterized by robust demand, though its condo market remained much softer. However, there were indications of increased hesitancy among some buyers as they tried to come to terms with new economic uncertainties both personal and macroeconomic.
Year over year, the supply of homes for sale rose about 9%, a far smaller increase than in other local markets, some of which saw jumps of 70% or more. The number of listings going into contract in April ticked up slightly, though the number of closed sales fell. The quantity of price reductions, which soared in most Bay Area Counties, remained flat from last year. The 3-month-rolling SF median house sales price was unchanged from April 2024, while the median condo sales price declined.
The homes seeing highest demand, and most likely to sell quickly with multiple offers, are houses in absolute move-in condition, often professionally staged, aggressively priced, and in prime locations.
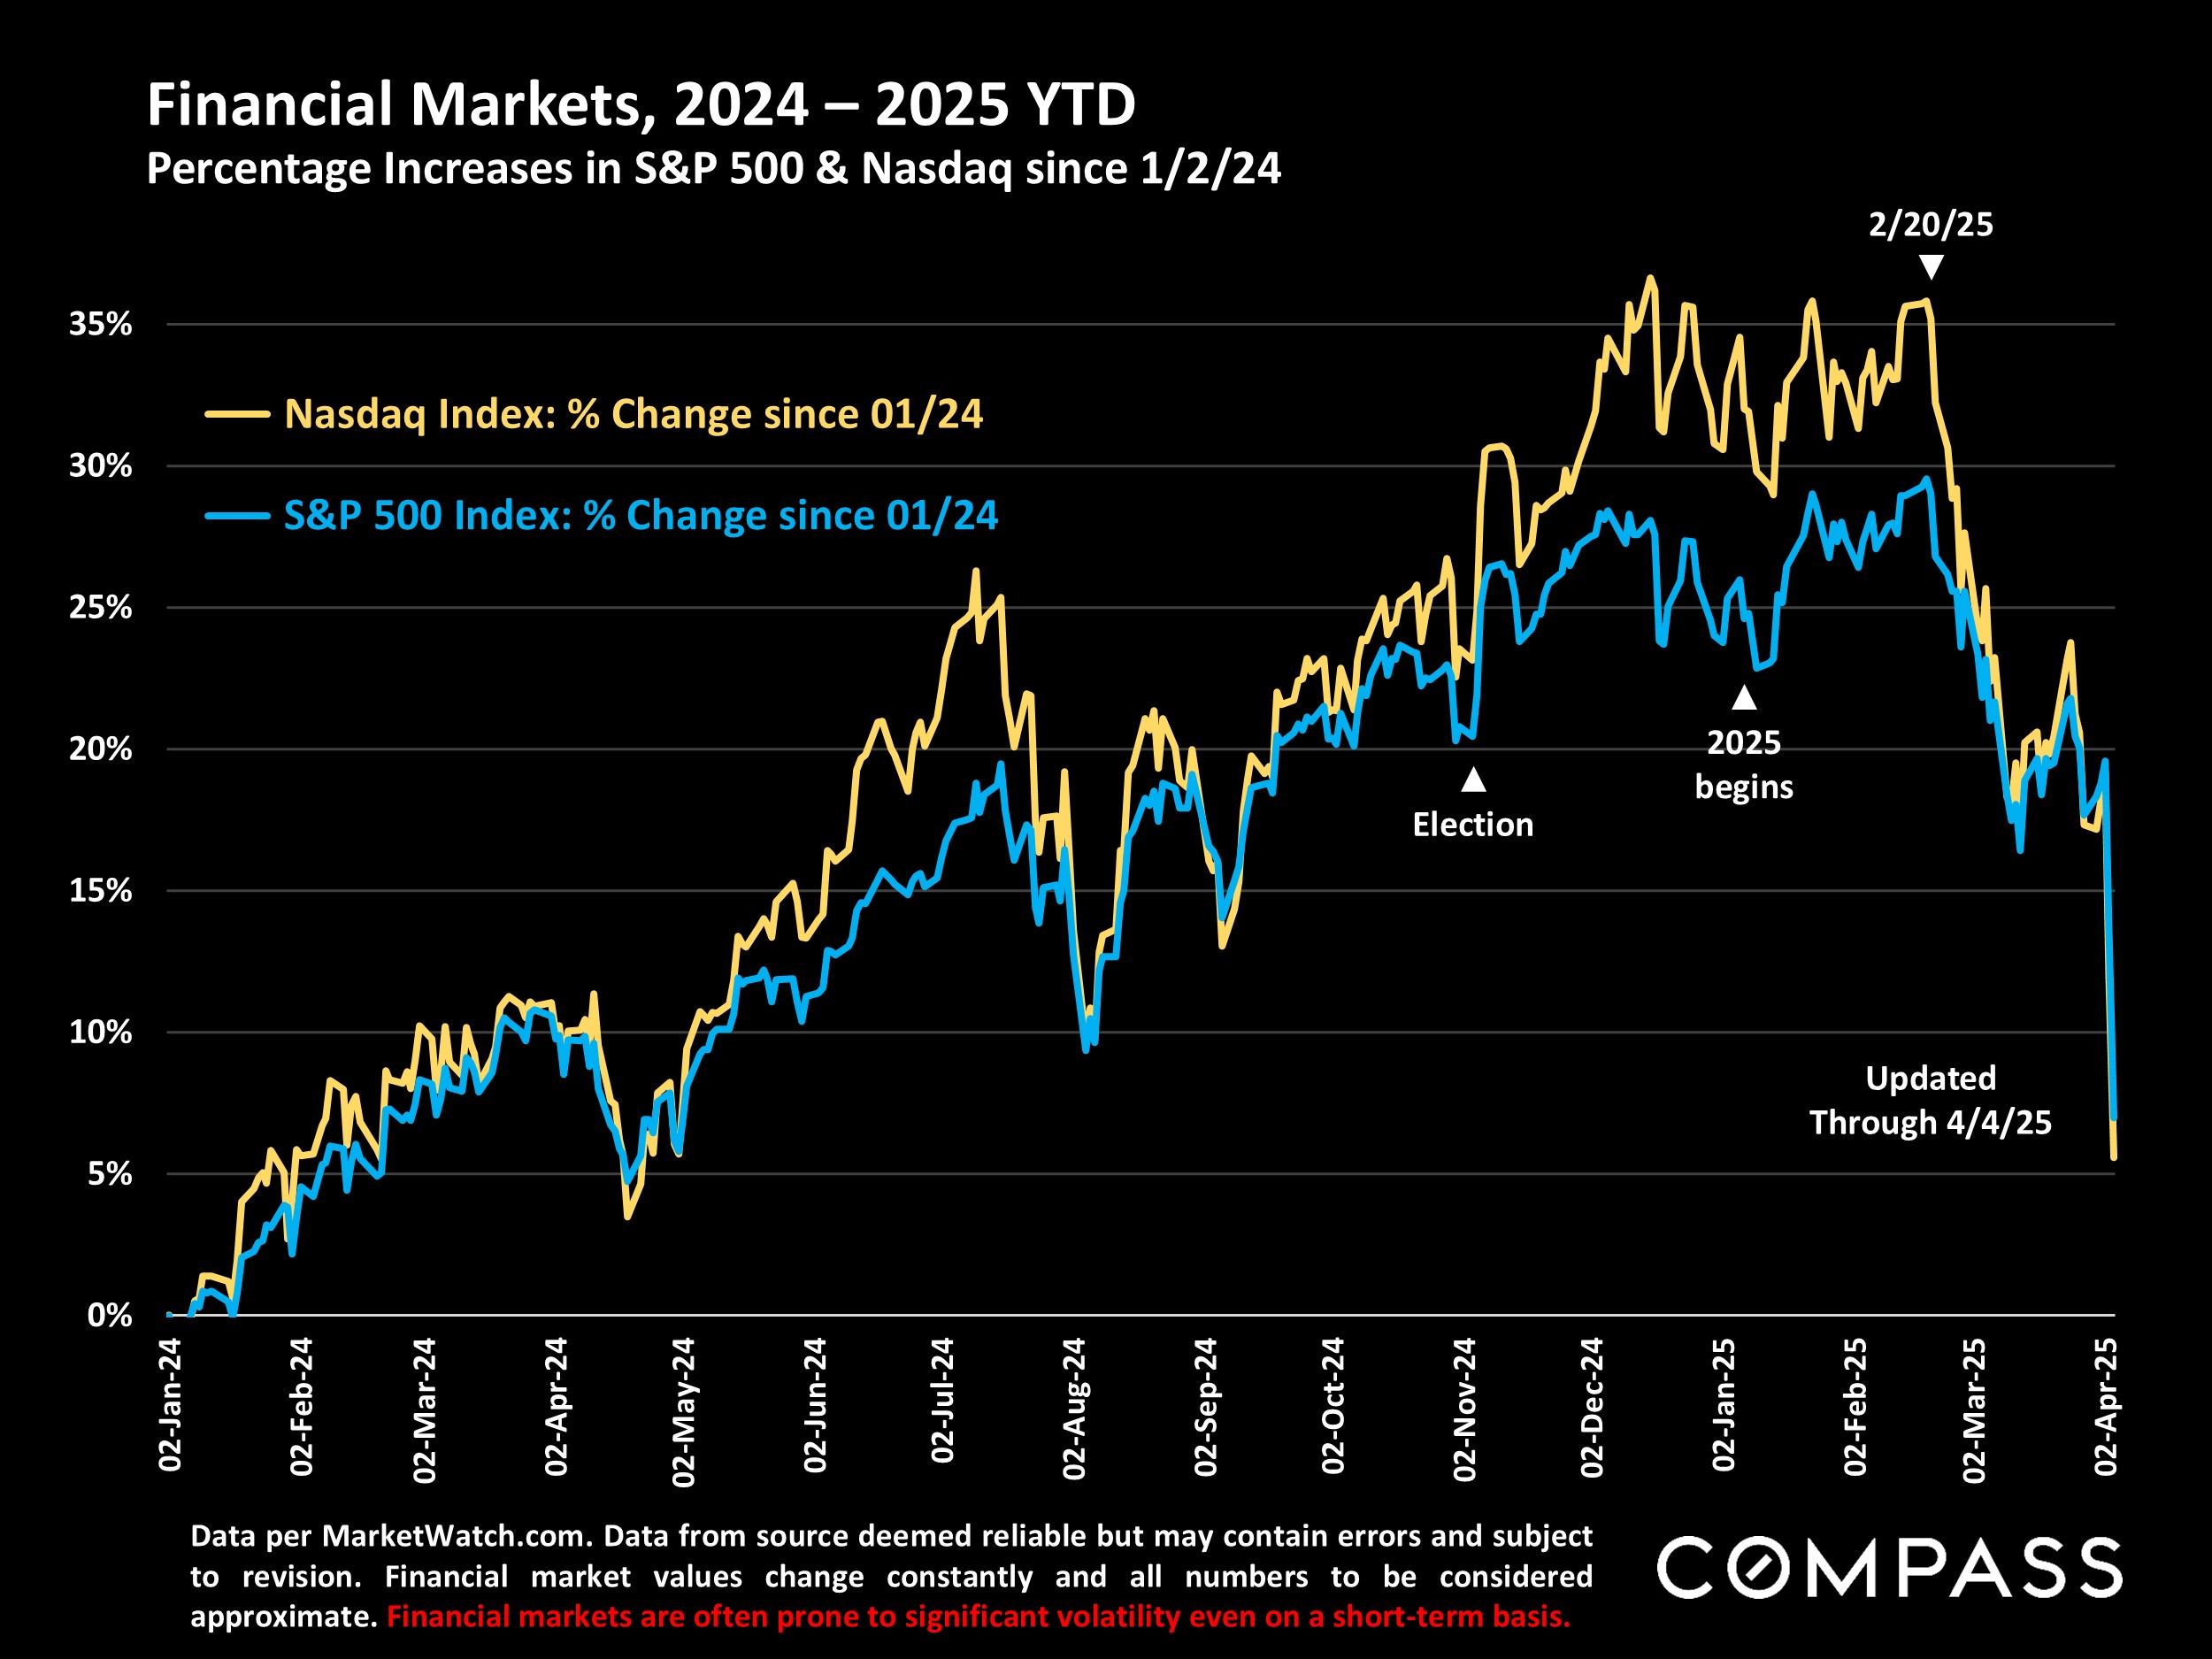
As of early May, the Fed kept its benchmark rate unchanged, mortgage rates continued to hover near 7%, but stock markets substantially recovered from early-April plunges. Consumer confidence saw precipitous declines last month amid the enormous political/economic volatility. Specific San
Francisco market data follows in this report but note that April sales statistics reflect many transactions that went into contract before the severe financial market conditions which began early in the month. May sales data may better reflect April market conditions.

DISCLAIMER: Statistics are generalities, essentially summaries of widely disparate data generated by dozens, hundreds or thousands of unique, individual sales occurring within different time periods. They are best seen not as precise measurements, but as broad, comparative indicators, with reasonable margins of error. Anomalous fluctuations in statistics are not uncommon, especially in smaller, expensive market segments. Last period data should be considered estimates that may change with late-reported data. Different analytics programs sometimes define statistics – such as “active listings,” “days on market,” and “months supply of inventory” – differently: what is most meaningful are not specific calculations but the trends they illustrate. Most listing and sales data derives from the local or regional multi-listing service (MLS) of the area specified in the analysis, but not all listings or sales are reported to MLS and these won’t be reflected in the data. “Homes” signifies real-property, single-household housing units: houses, condos, co-ops, townhouses, duets and TICs (but not mobile homes), as applicable to each market.
City/town names refer specifically to the named cities and towns, unless otherwise delineated. Multi-county metro areas will be specified as such. Data from sources deemed reliable, but may contain errors and subject to revision. All numbers to be considered approximate. Many aspects of value cannot be adequately reflected in median and average statistics: curb appeal, age, condition, amenities, views, lot size, quality of outdoor space, “bonus” rooms, additional parking, quality of location within the neighborhood, and so on. How any of these statistics apply to any particular home is unknown without a specific comparative market analysis.
Median Sales Price is that price at which half the properties sold for more and half for less. It may be affected by seasonality, “unusual” events, or changes in inventory and buying trends, as well as by changes in fair market value. The median sales price for an area will often conceal an enormous variety of sales prices in the underlying individual sales.
Dollar per Square Foot is based upon the home’s interior living space and does not include garages, unfinished attics and basements, rooms built without permit, patios, decks or yards (though all those can add value to a home). These figures are usually derived from appraisals or tax records, but are sometimes unreliable (especially for older homes) or unreported altogether. The calculation can only be made on those home sales that reported square footage.
Photo use under the Creative Commons License: https://creativecommons.org/licenses/by-sa/2.0/
Compass is a real estate broker licensed by the State of California, DRE 01527235. Equal Housing Opportunity. This report has been prepared solely for information purposes. The information herein is based on or derived from information generally available to the public and/or from sources believed to be reliable. No representation or warranty can be given with respect to the accuracy or completeness of the information. Compass disclaims any and all liability relating to this report, including without limitation any express or implied representations or warranties for statements contained in, and omissions from, the report. Nothing contained herein is intended to be or should be read as any regulatory, legal, tax, accounting or other advice and Compass does not provide such advice. All opinions are subject to change without notice. Compass makes no representation regarding the accuracy of any statements regarding any references to the laws, statutes or regulations of any state are those of the author(s). Past performance is no guarantee of future results.