Ongoing volatility in political/economic conditions – particularly the plunge in stock markets in April, which affected May home sales – took some of the wind out of the spring real estate market, usually the most dynamic of the year. Uncertainty regarding the economy and the possible implications for personal financial circumstances understandably made a proportion of buyers and sellers hesitant about moving forward. Still, while most Bay Area markets slowed year over year, there was nothing approximating a crash. As inventory continued to rise, sales activity failed to keep pace, resulting in lower absorption rates (a comparison of demand vs. supply). With more homes for sale and somewhat less competition between buyers, overbidding generally declined, time-on-market ticked up, and price reductions increased. Most counties saw small year-over-year declines in their 3-month-rolling median home sales prices.
But many of these indicators of slowdown did not occur in San Francisco, which had one of the Bay Area’s strongest markets in May: SF median sales prices rose, inventory remained steady, and both the number of listings going into contract and the % of sales sold for over asking price increased.
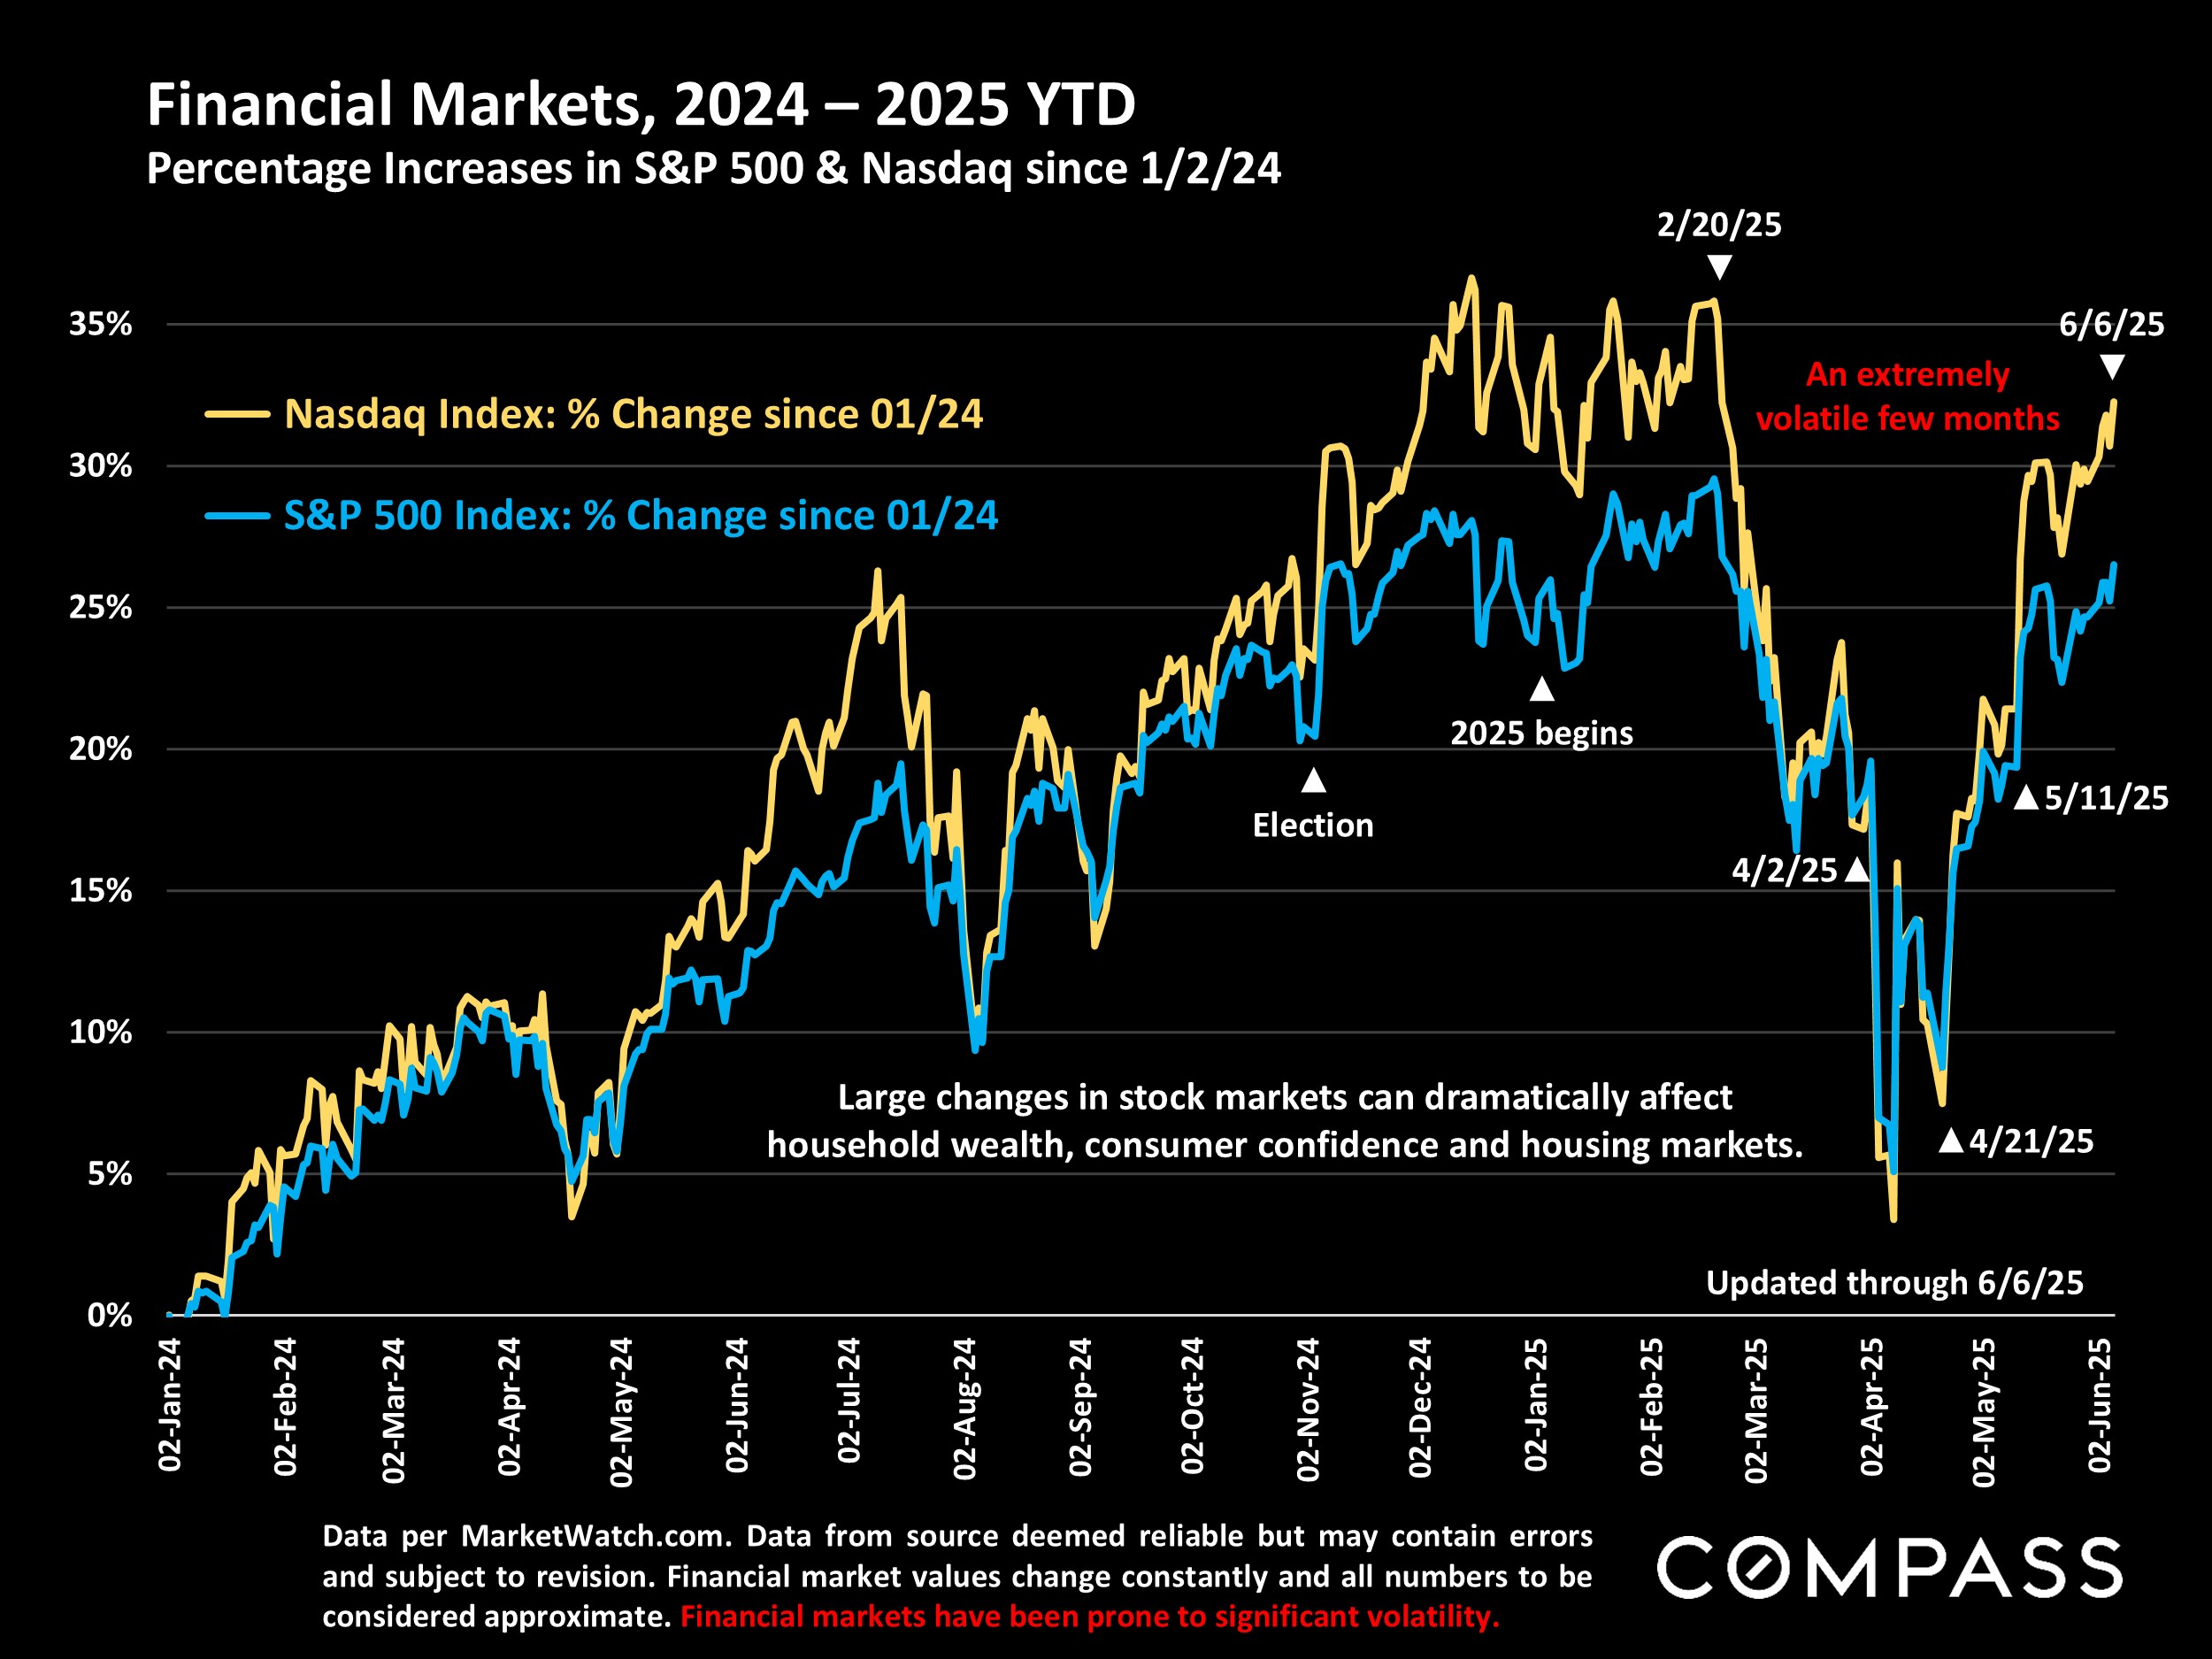
It’s worth noting that virtually all May sales were negotiated before the May 12 reversal of China-tariff policies, which triggered an enormous rebound in the stock market. Unlike stocks, home sales don’t reflect shifts in market conditions instantly – there is typically a 3-to-6-week lag between offer acceptance and close of sale – and there are indications that the effects of April’s negative economic gyrations on buyer and seller psychology in the Bay Area may already be fading.
The speed and scale of developments in 2025 – tariffs, stock markets, inflation, interest rates, consumer confidence, tax law, national debt concerns, international relations, what the Fed decides, and so on – have made it challenging for real estate market reports to keep up. As always, real estate trends vary locally. The rest of this report focuses on the specifics of the San Francisco market.
Report created in good faith using data from sources deemed reliable but may contain errors and subject to revision. Last period figures are preliminary estimates based on data available early in the following month. All numbers approximate, and may change with late-reported activity.

DISCLAIMER: Statistics are generalities, essentially summaries of widely disparate data generated by dozens, hundreds or thousands of unique, individual sales occurring within different time periods. They are best seen not as precise measurements, but as broad, comparative indicators, with reasonable margins of error. Anomalous fluctuations in statistics are not uncommon, especially in smaller, expensive market segments. Last period data should be considered estimates that may change with late-reported data. Different analytics programs sometimes define statistics – such as “active listings,” “days on market,” and “months supply of inventory” – differently: what is most meaningful are not specific calculations but the trends they illustrate. Most listing and sales data derives from the local or regional multi-listing service (MLS) of the area specified in the analysis, but not all listings or sales are reported to MLS and these won’t be reflected in the data. “Homes” signifies real-property, single-household housing units: houses, condos, co-ops, townhouses, duets and TICs (but not mobile homes), as applicable to each market.
City/town names refer specifically to the named cities and towns, unless otherwise delineated. Multi-county metro areas will be specified as such. Data from sources deemed reliable, but may contain errors and subject to revision. All numbers to be considered approximate. Many aspects of value cannot be adequately reflected in median and average statistics: curb appeal, age, condition, amenities, views, lot size, quality of outdoor space, “bonus” rooms, additional parking, quality of location within the neighborhood, and so on. How any of these statistics apply to any particular home is unknown without a specific comparative market analysis.
Median Sales Price is that price at which half the properties sold for more and half for less. It may be affected by seasonality, “unusual” events, or changes in inventory and buying trends, as well as by changes in fair market value. The median sales price for an area will often conceal an enormous variety of sales prices in the underlying individual sales.
Dollar per Square Foot is based upon the home’s interior living space and does not include garages, unfinished attics and basements, rooms built without permit, patios, decks or yards (though all those can add value to a home). These figures are usually derived from appraisals or tax records, but are sometimes unreliable (especially for older homes) or unreported altogether. The calculation can only be made on those home sales that reported square footage.
Photo use under the Creative Commons License: https://creativecommons.org/licenses/by-sa/2.0/
Compass is a real estate broker licensed by the State of California, DRE 01527235. Equal Housing Opportunity. This report has been prepared solely for information purposes. The information herein is based on or derived from information generally available to the public and/or from sources believed to be reliable. No representation or warranty can be given with respect to the accuracy or completeness of the information. Compass disclaims any and all liability relating to this report, including without limitation any express or implied representations or warranties for statements contained in, and omissions from, the report. Nothing contained herein is intended to be or should be read as any regulatory, legal, tax, accounting or other advice and Compass does not provide such advice. All opinions are subject to change without notice. Compass makes no representation regarding the accuracy of any statements regarding any references to the laws, statutes or regulations of any state are those of the author(s). Past performance is no guarantee of future results.